The NASL season is over, and the final placements of each team have been earned. Congratulations to the champion New York Cosmos (ranked #2 in the final PR) and congratulations to the runner up Ottawa Fury (ranked #1) on an excellent season.
To celebrate the completion of one whole year of NASL Power Rankings, which in 2015 were posted on NorthernPitch.com, I’ve compiled some fun stats about how the year looked on these pages.
The first thing to examine is each team’s average ranking. Is there wisdom in this holistic approach? Not really, it might seem. We see in these averages the lingering effects of mistaken and dearly held assumptions. The Tampa Bay Rowdies, who spent a third of the year playing like a soccer team, still make the top four, as they staggered to a fifth place overall finish. Meanwhile the Ottawa Fury are only third in average ranking, weighed down by terrible preseason expectations. The final playoff team, Fort Lauderdale, are sixth in average ranking. The Strikers were pretty awful for much of the year, but still managed to keep pace until they sorted themselves out fairly late.
Average Power Rankings (Range)
New York Cosmos – 1.7 (1st-5th)
Minnesota United – 3.3 (1st-6th)
Ottawa Fury – 3.9 (1st-9th)
Tampa Bay Rowdies – 4.4 (2nd-9th)
Edmonton – 5.7 (2nd-10th)
Fort Lauderdale Strikers – 6.1 (3rd-11th)
Atlanta Silverbacks – 7.1 (4th-11th)
Carolina RailHawks – 7.2 (3rd-11th)
Jacksonville Armada – 8.5 (5th-11th)
Indy Eleven – 8.8 (3rd-11th)
San Antonio Scorpions – 9.3 (4th-11th)
Over-formatted Excel Graph:
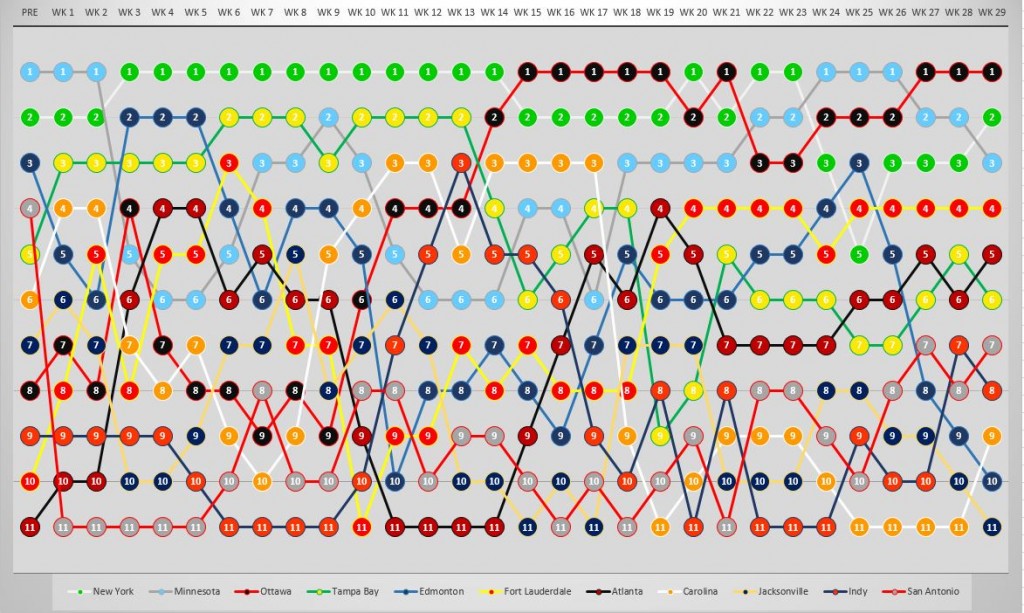
Here’s are an entire season’s worth of rankings in graphic form:

It’s hard to say to what degree a Power Ranking is supposed to be descriptive or predictive. Still, it feels fair to say that a good power ranking should be quick to identify lasting trends and immune to temporary ones. With that metric in mind…
What I got right:
The preseason ranking put the defending champion San Antonio in fourth, but the week one rank dropped the Scorpions seven points to the last spot. It was a drastic correction, but it was the correct one. San Antonio were never contenders this season and the Scorpions would only get two points in their first four matches to start the season—earning that dire rating in week one.
The ranking was also quick to pick up on Ottawa’s strength. Despite being in 9th place after the spring season, the power ranking had the Fury placed 4th in week eleven, at the start of the break. The Fury reached the top spot in week fifteen, and held onto it for nine of the fall season’s eighteen weeks of play.
What I got wrong:
The rankings of the Carolina RailHawks and the Tampa Bay Rowdies were too slow to recognize that these teams had lost their edge. In particular, Carolina dropped from third to ninth in week eighteen, after two 0-3 losses, but the malaise had been clear before that and the RailHawks should’ve been lower earlier. The same is true for Tampa, who maintained a respectable ranking and were fourth when the infamous midseason firings occurred, which prompted a sharp five place drop.
Finally, the ranking way too generous to Edmonton, who seemed all year to be on the cusp of clicking. But it never came. I really struggled to rank the Eddies all season. They mixed excellent results with awful ones. Only Ottawa had a range of ranks as broad as Edmonton, but while the Fury went generally up, the Eddies started in third, dropped to sixth, jumped to second, went back to sixth, jumped to fourth, plunged to tenth, and then worked their way all the way up to third before collapsing back down to tenth. Somewhere along the line, the ranking should’ve simply accepted Edmonton’s inconsistency and factored it into a middling grade.
Photographs
Almost every week, I used a photograph from somewhere around the league to highlight the important storylines, or at least to highlight good photography (For the preseason PR, I used a custom graphic and for week sixteen I used a screenshot of Miguel Gallardo looking dead on the inside.). Naturally, some teams were used more often than others, thanks to the quality of their photo teams.
TBR: Six (Weeks 4,7,10,12,19,28)
NYC: Five (Weeks 3,11,22,25,29)
MNU: Four (Weeks 6,8,23,26)
JAX: Four (Weeks 1,5,9,18)
OTT: Three (Weeks 14,15,27)
IND: Three (Weeks 13,17,21)
FTL: Two (Weeks 2,20)
SAS: One (Week 24)
Atlanta, Carolina, and Edmonton, step your game up!
All 30 Posts (Links back to NorthernPitch.com)
Pre — 1 — 2 — 3 — 4 — 5 — 6 — 7 — 8 — 9 — 10 — 11 — 12 — 13 — 14 — 15 — 16 — 17 — 18 — 19 — 20 — 21 — 22 — 23 — 24 —25 — 26 — 27 — 28 — 29
Enjoyed the PR this year? Hated the PR? Suggestions for next season? Let me know in the comments below!

Leave a Reply